
Below, in the article, we will, of course, skip the chalk drawing and tell you how to create a Venn diagram using PowerPoint. This skill is helpful for both a freelancer who creates slides for a fee and a seasoned businessman who needs to explain his ideas to investors or the general public. Two circles. What could be easier?
Table of Contents
- How to Create a Venn Diagram using PowerPoint: Step by Step
- How to Show Venn Diagram Elements Using Powerpoint Tools
- Place the Venn Diagram Slide into your Powerpoint Presentation
- Use Pre-made Venn Diagram Slides
How to Create a Venn Diagram using PowerPoint: Step by Step
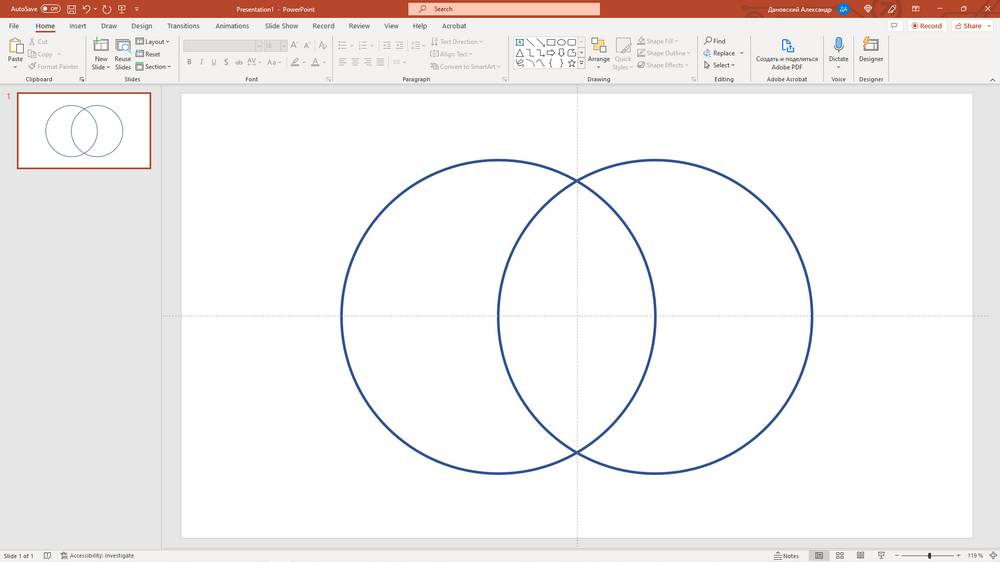
Here are two intersecting circles. This is a Venn diagram created using MS Powerpoint software.
Let’s draw it all by ourselves. Open a new slide in your Powerpoint, and let’s get started.
- Go to the Home tab and select the Oval shape in the Drawing group.
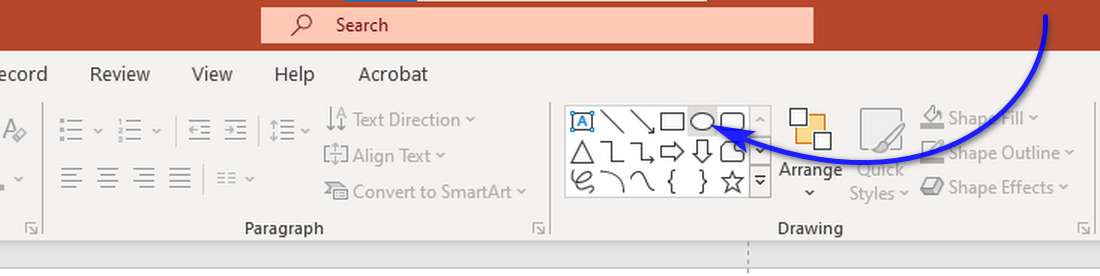
- Select a suitable place on the slide, press the left mouse button, and draw a circle.
Tip: if you want a perfect circle, press and hold the Shift key. Otherwise, you may end up with an oval instead of a circle. - Follow step 2 and draw another circle.
Tip: you can just copy Ctrl-C, paste Ctrl-V a copy of the first circle, and then move it on the slide to the position you need. - That’s all! Here is the finished Venn diagram. Probably, it would be enough for the brilliant presentations of Steve Jobs…
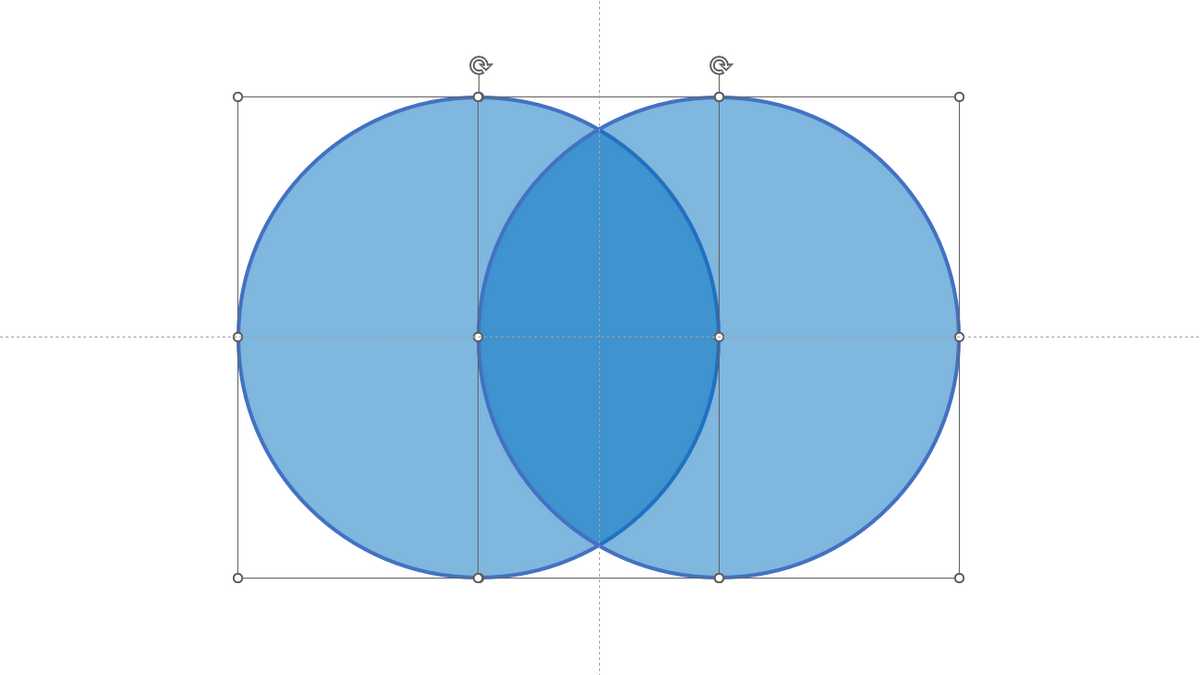
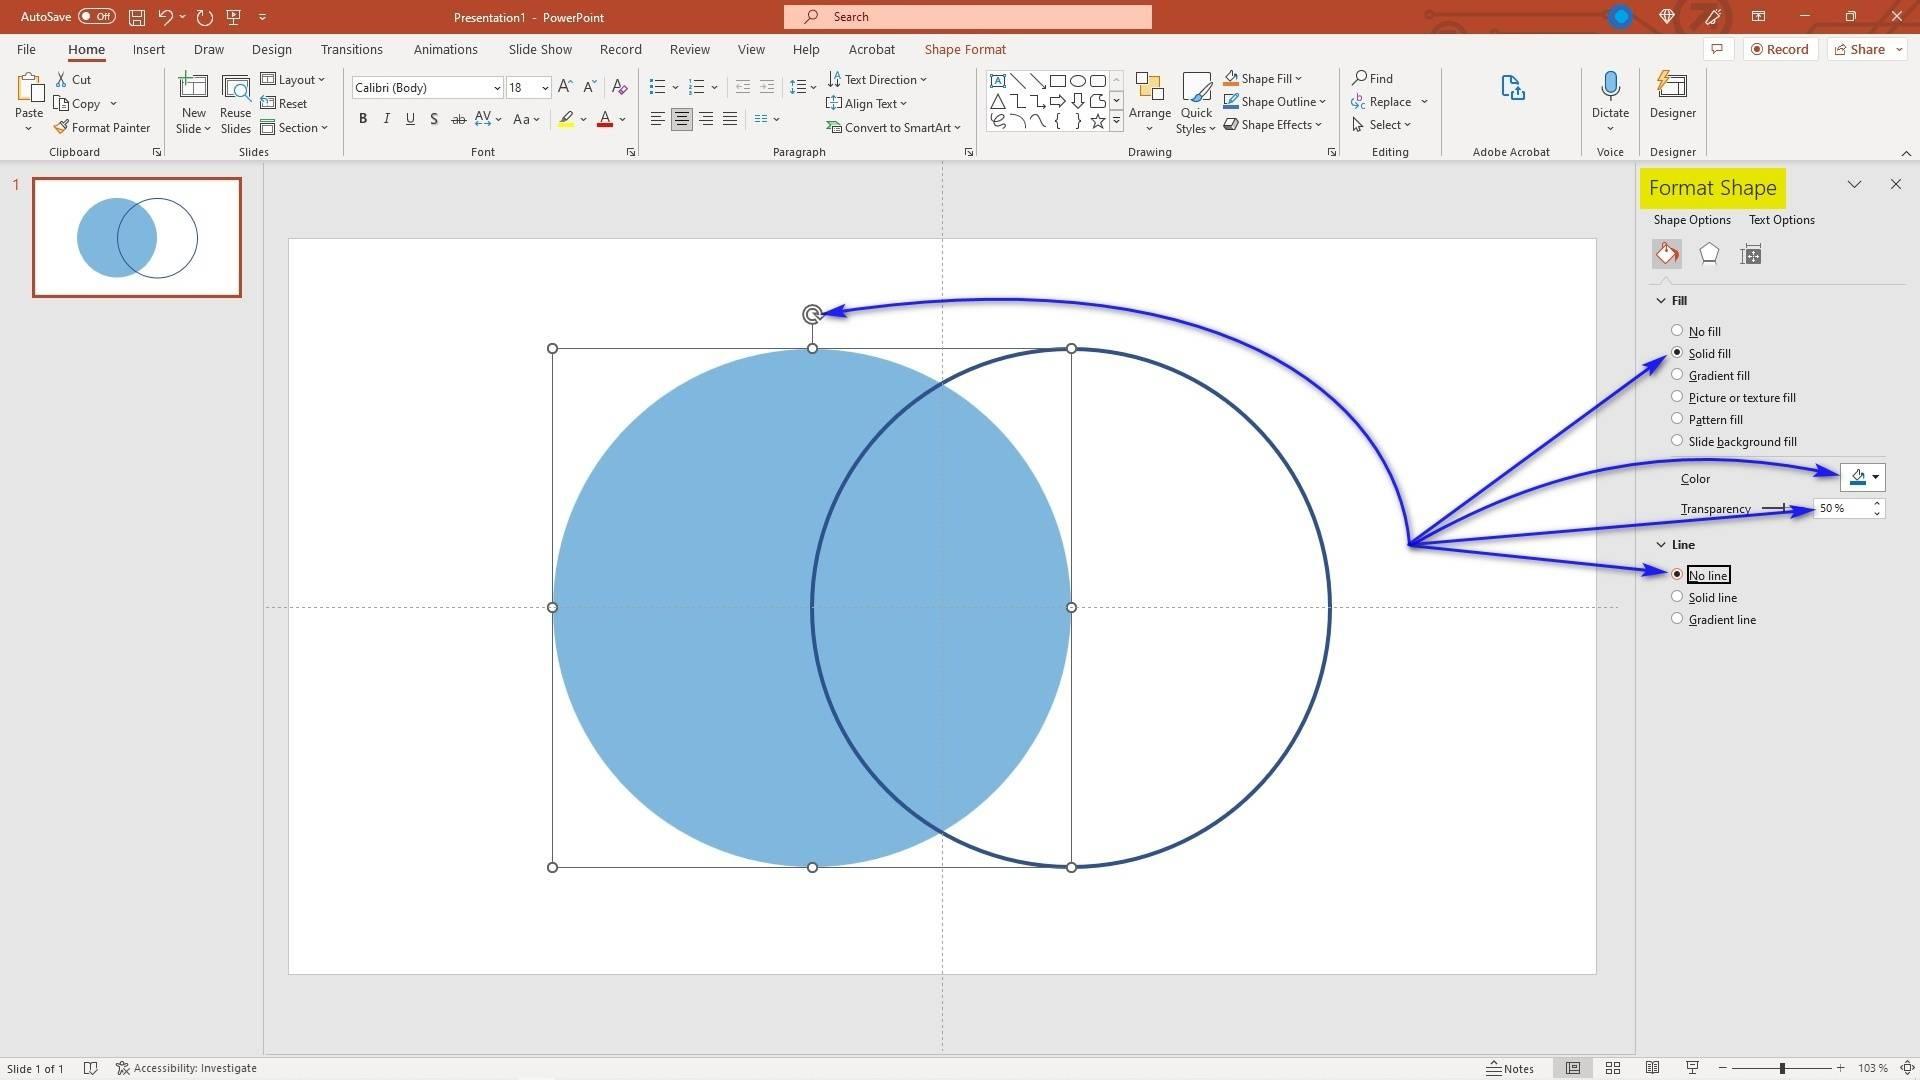
Tip: …but if you’re going to be presenting to investors or a general audience, it’s better to add some color to make it a little brighter. - To add color, right-click on the line around the circle and select Format Shape from the menu that appears. The shape properties pane will appear on the left. Use it to set the color and transparency properties for the first and the second circle. For example
- 50% transparency for both circles,
- blue color. and yellow color for the first and second circles respectively,
- in the same place, you can set the values of the line properties, if necessary.

Finally, if you did everything right in Powerpoint, then your Venn diagram should look like this:
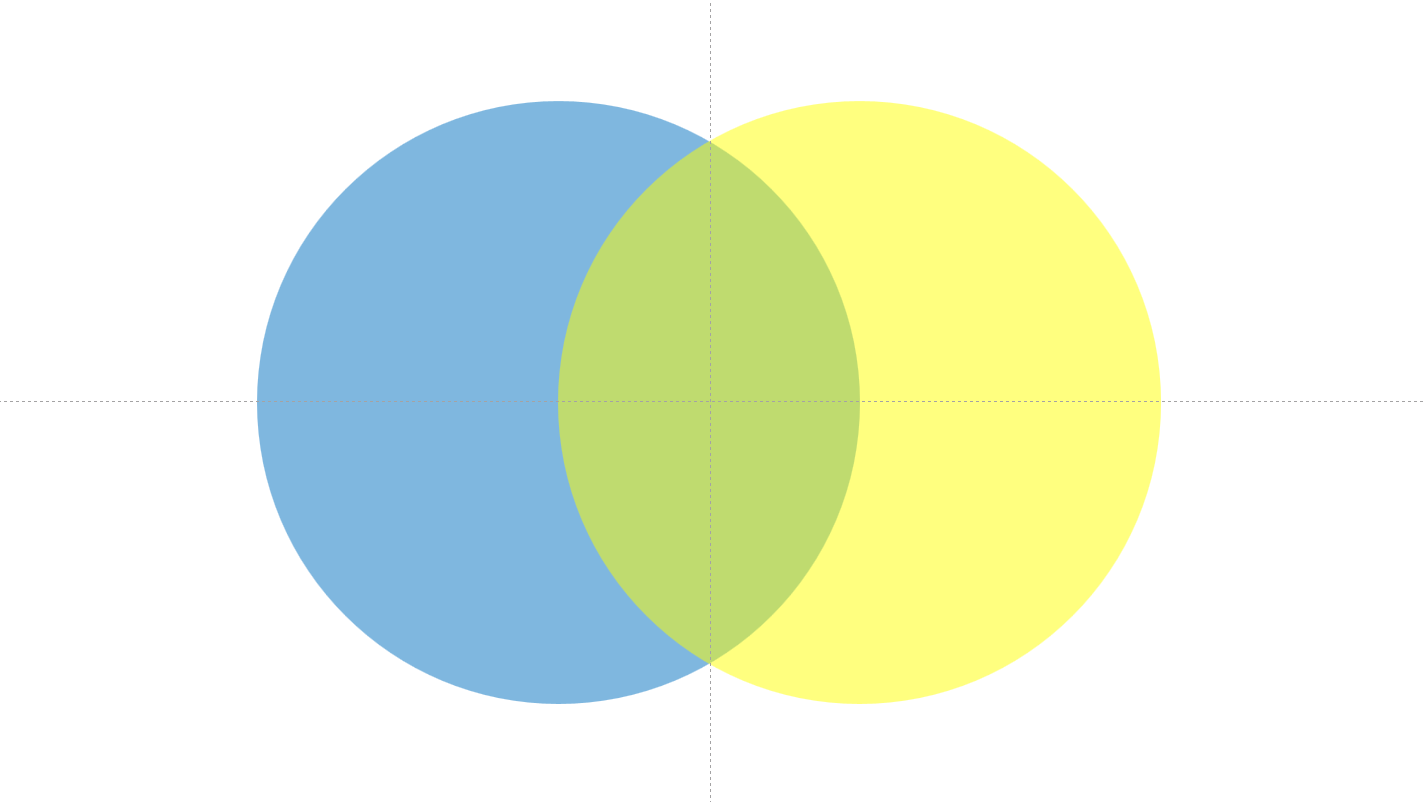
As you can see, it didn’t take long to draw the two circles of the Venn diagram. Using Powerpoint, we even managed to color them in a bit.
Notice how the two colors blend at the intersection of the circles. This is the essence of the Venn diagram. It shows how two entities, two sets, interact and how a third entity is formed from this interaction.
However, it is better to talk about this later. And at the same time, see what else you can do with a Venn diagram using Powerpoint.
How to Show Venn Diagram Elements Using Powerpoint Tools
The individual elements of Venn diagrams can be very informative and are therefore used to add visual clarity to the presentation. Powerpoint has several tools for creating and manipulating these elements of Venn diagrams.
To get to these tools, you will need to select both circles. To do this, click the first circle with the mouse, then press and hold the Ctrl key and click the second circle. Ready! You see, the Shape Format tab has appeared in the main menu. Click it, and in the Insert Shapes group click the Merge Shapes button. A drop-down menu will appear with five options.
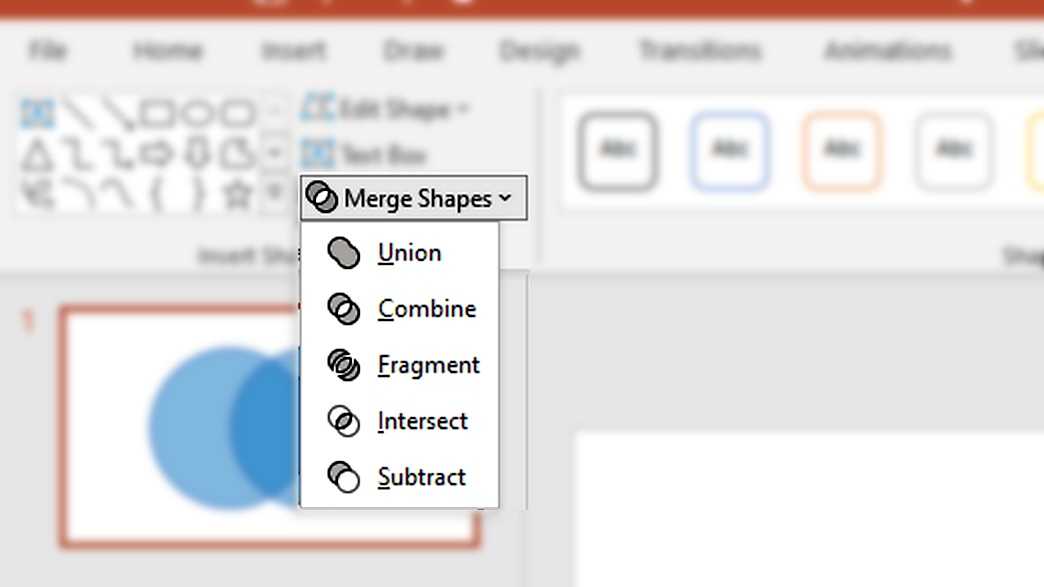
We have reached the most interesting! These five Powerpoint options will allow you to manipulate the elements of a Venn diagram. Let’s take a closer look at them.
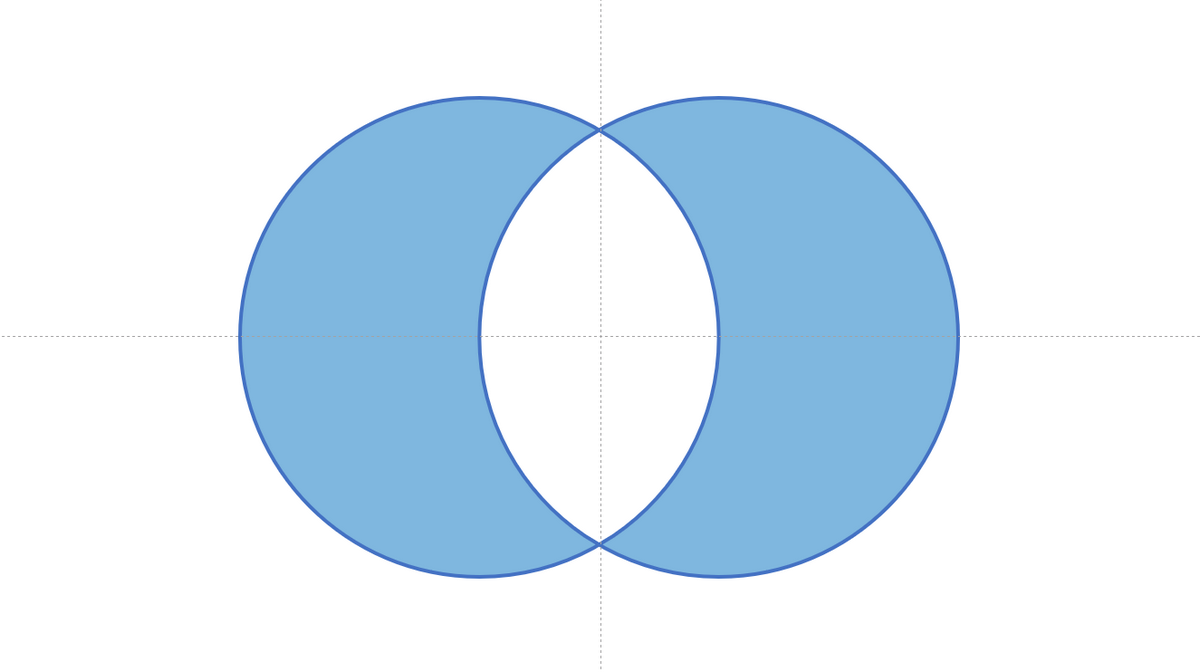
Union
The Powerpoint Union tool forms an element of the Venn diagram structure, which is called Union.
Here it illustrates a combination of two circles, or, in other words, a combination of two sets. The result set is all the elements from both sets combined. This can be used to illustrate the concept of conjunctions in mathematics, set theory, or logical operations such as AND.
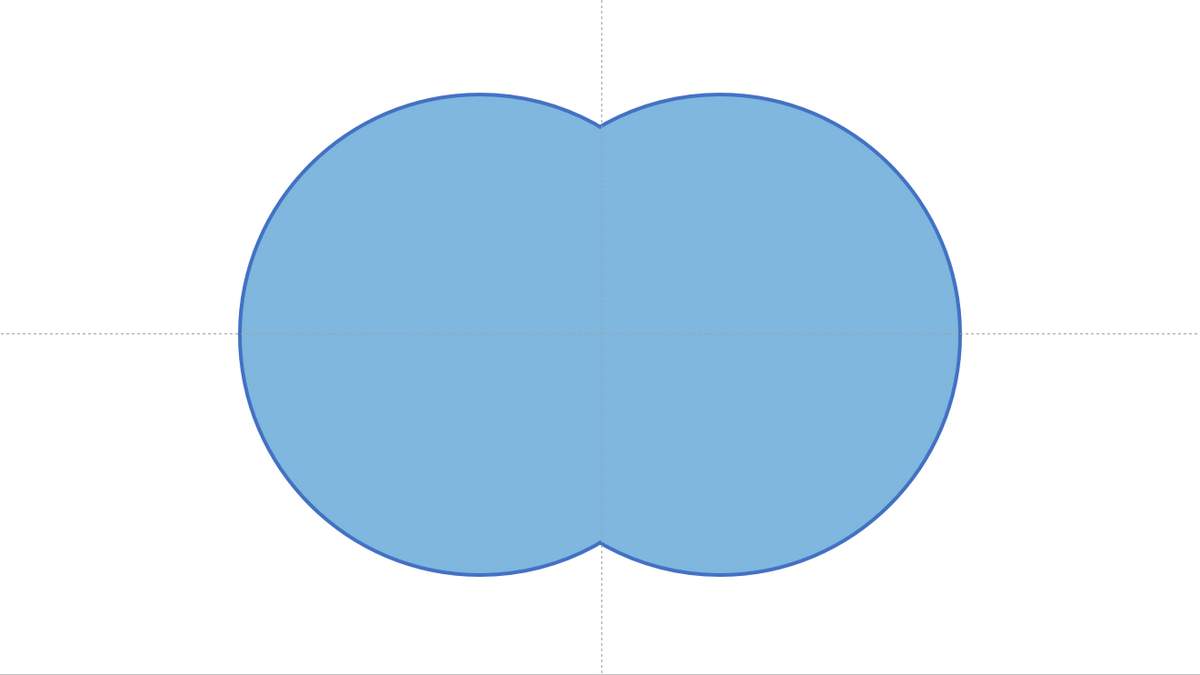
It is a useful tool for visually explaining complex concepts, especially if they need to be explained to a global audience.
Combine
The Powerpoint Combine tool forms an element of the Venn diagram structure, which is called Symmetric Difference or Disjunctive Union.
The symmetric difference is the set of elements that are in either of the sets, but not in their intersection.
This element of the Venn diagram has practical applications in mathematics and computer science as an effective algorithm for solving optimization problems. For example, the symmetric difference is a useful tool for finding the maximum and minimum values in a given set of numbers.
Intersect
The Powerpoint Intersect tool forms an element of the Venn diagram structure, which is called Intersection.
The intersection is the set containing all elements of the first circle that also belong to the second circle.
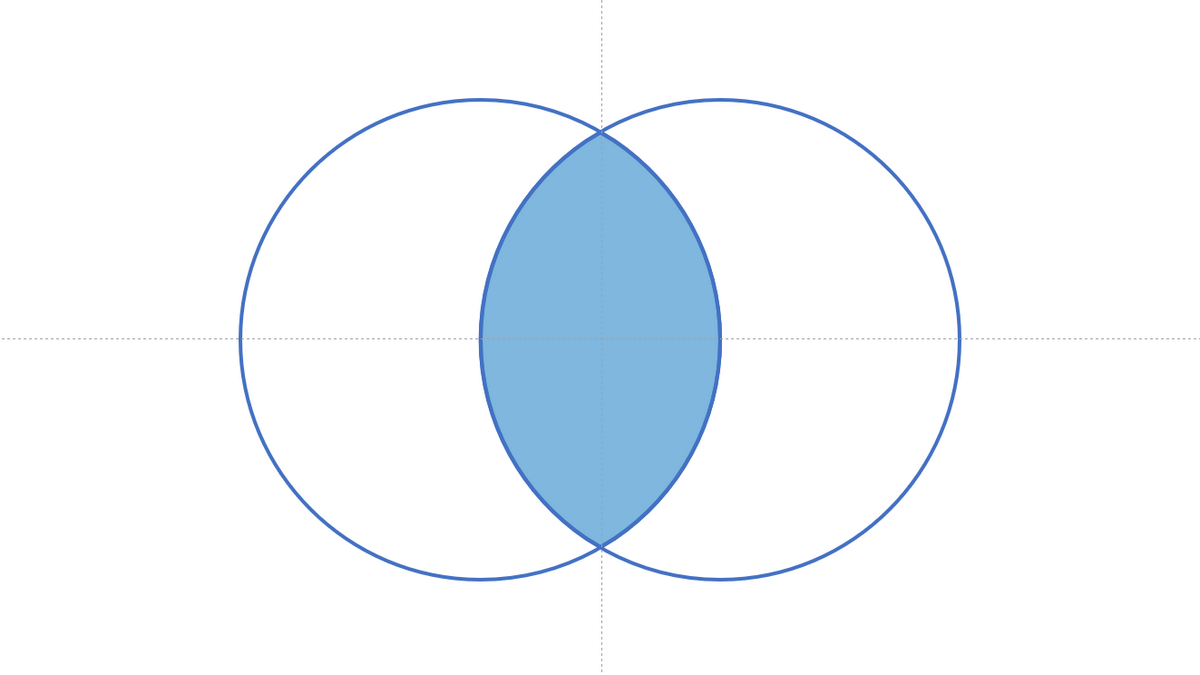
The Powerpoint Intersect tool is useful for a variety of applications including analyzing marketing data, research data, and financial data. It can also be used to identify trends in datasets.
With the intersect tool, users can quickly assess relationships between different sets of data and easily determine which elements are shared among them. This allows for better decision-making and informed decisions as it eliminates guesswork and provides a reliable source of insight.
Subtract
The Powerpoint Subtract tool forms an element of the Venn diagram structure, which is called Relative Complement. This element of the Venn diagram is a mathematical or logical abstraction. It is used in practice to refer to a set that is part of the first set but not necessarily part of the second.
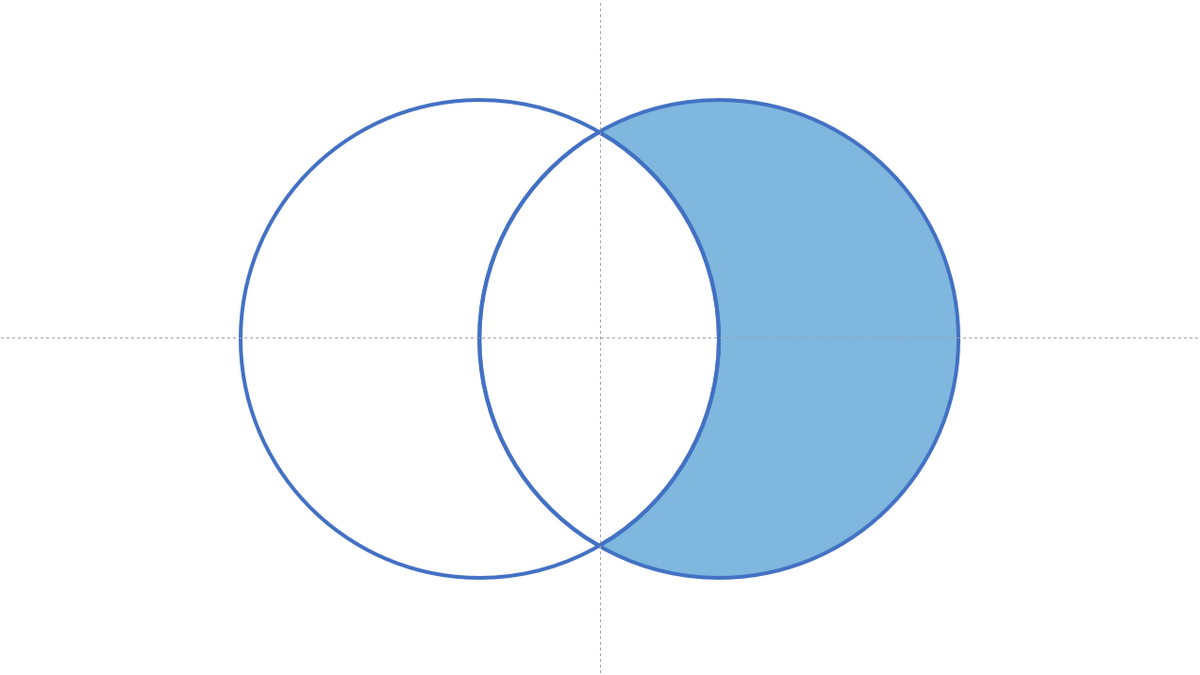
This is useful, for example, when comparing two sets of data where the second set is a subset of the first.
Fragment
The Powerpoint Fragment tool does not match the set of Venn diagram elements. But using it allows the slide developer to turn the diagram into a full set of these elements with one click.
Look at the diagram image at the beginning of the article. It shows two circles as two Powerpoint objects that intersect.
If we apply the Fragment tool to the union of these two circles, we will get three independent objects. Each of them will have its own properties: color, transparency, lines, etc.
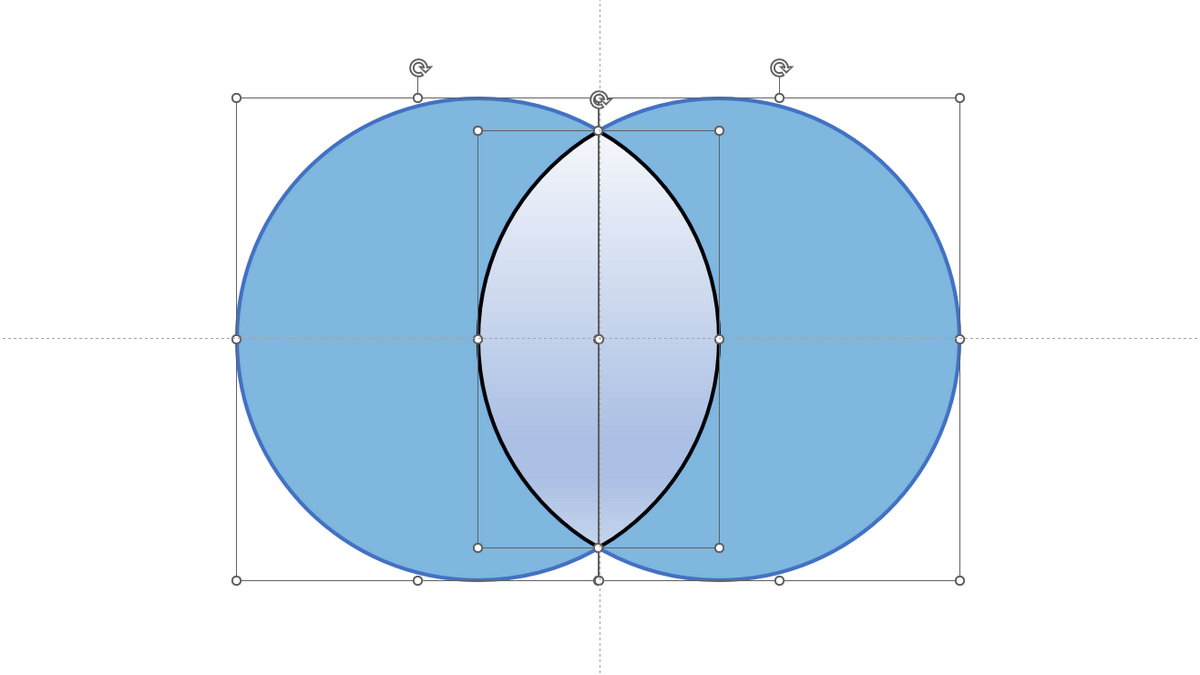
Now you have all the elements of a Venn diagram on one Powerpoint slide! You can change their properties or hide, show, and animate them. Anything you want!
Place the Venn Diagram Slide into your Powerpoint Presentation
Of course, in this form, your slide needs to be improved. It would be nice to add a title, explanatory captions, and other visuals that give your work a finished, logical look. As a result, you should get something like this:
Now that the slide is finalized place it into your presentation. To do this, right-click on the slide thumbnail on the left and copy/paste it into the place of the presentation you want.
In the same way, you can insert a pre-made slide into your presentation, which you can find on poweredtemplate.com. The image above is one such pre-made slide.
Use Pre-made Venn Diagram Slides
Are you ready to impress a room of viewers with an impeccable presentation? Look no further than PoweredTemplate for a stylish way to level up your next presentation. Their Venn diagram templates for Powerpoint are crafted by top designers from around the world, making it easy for you to create a visually stunning and professional-looking presentation. With both free and premium options available, you can easily find the perfect Venn diagram template in either MS Powerpoint or Google Slides, taking all of the torment out of creation while still making sure your audience gets wowed!
We have provided examples of just a few of them below. Take a look and choose what suits your ideas. You can quickly adjust the color, size, and other settings using pre-made Venn diagram slides.
With a few clicks – and your slide is ready.
Colored Venn Diagram Free PowerPoint Template
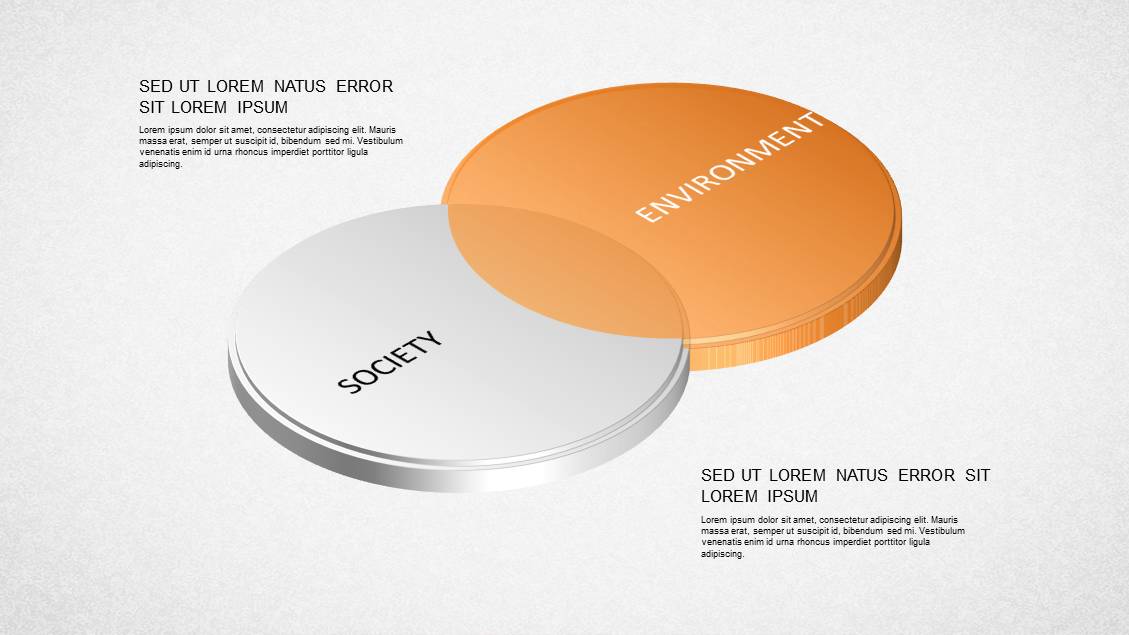
The Colored Venn Diagram presentation template is a dynamic and visually stunning tool designed to help you present complex information in a clear and concise manner. This template offers a range of Venn diagrams with 2 to 6 sets, each created in a 3D style using isometric projection. The isometric projection gives a sense of depth and dimensionality to the diagrams, making them more engaging and memorable for your audience.
Each diagram features a unique color scheme, with shades that contrast and complement each other to help emphasize the different areas of overlap. The template is designed exclusively for PowerPoint, ensuring that you have all the tools you need to create a high-quality presentation. With 16 slides in a 4:3 ratio, this template offers plenty of options to choose from, whether you’re looking for a simple two-set diagram or a more complex five or six-set diagram.
Whether you’re presenting sales data, market research, or any other kind of information that requires the use of Venn diagrams, the Colored Venn Diagram presentation template is an excellent choice. Its clean, modern design and bold use of color make it easy to read and understand, while the 3D isometric projection adds a touch of sophistication and depth to your presentation.
Transparent Venn Diagram Free PowerPoint Template
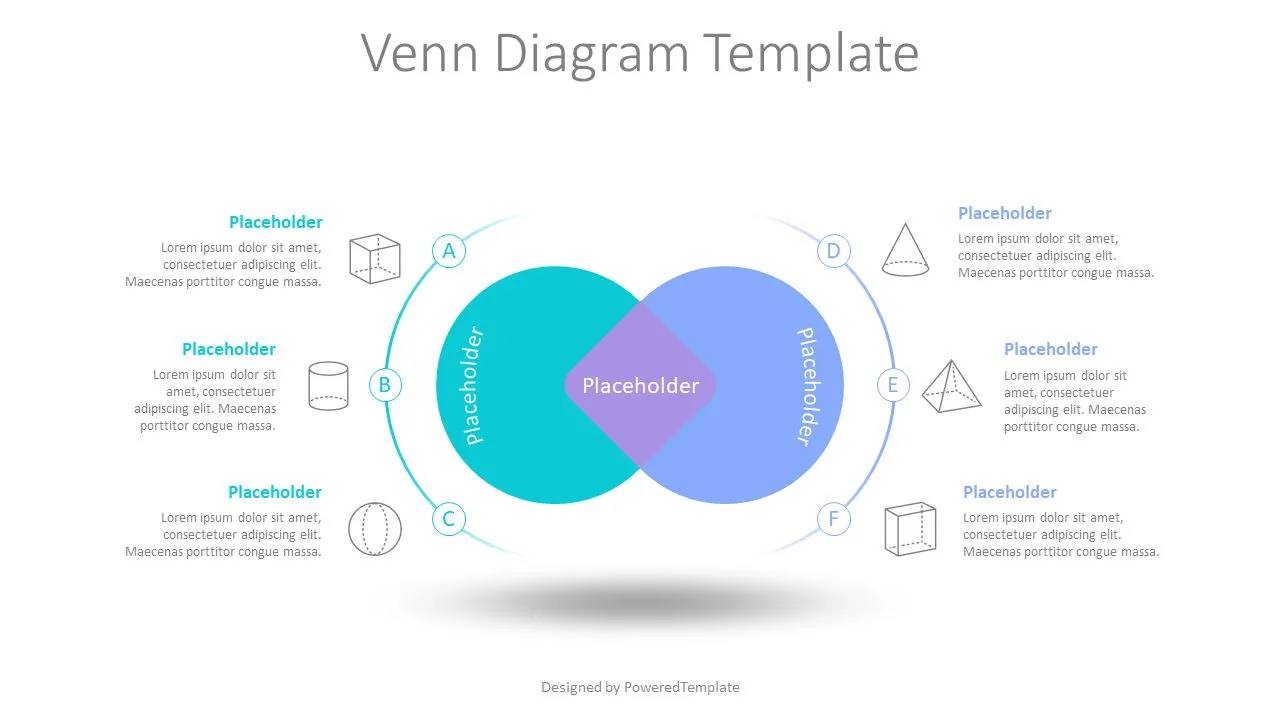
This template features a professional and visually appealing 8-set Venn diagram, perfect for illustrating complex relationships and overlapping concepts. With 15 slides, including both light and dark backgrounds, you’ll have plenty of options to customize your presentation. The template is designed to work seamlessly in both PowerPoint and Google Slides, so you can use the platform you’re most comfortable with.
Each circle in the diagram is color-coded and labeled for easy identification, and the overlapping sections are clearly defined. The 4:3 ratio of the template ensures that your presentation will look great on any screen or projector. Whether you’re presenting data, analyzing market trends, or exploring complex ideas, this Venn diagram template is a versatile and powerful tool to help you communicate your message effectively.
Transparent Diamonds Diagram PowerPoint Template
The Transparent Diamonds Diagram presentation template is a modern and visually stunning option for creating Venn diagrams and process timelines in your presentations. The template is designed to work seamlessly with PowerPoint and Google Slides, allowing you to easily create and customize professional-looking diagrams to suit your specific needs.
One of the unique features of this template is the use of transparent diamond-shaped triangles for the Venn diagrams, which gives your diagrams a fresh and modern look. There are both 3-set and 4-set Venn diagrams included in the template, as well as timeline process diagrams, giving you plenty of options for showcasing your data and ideas.
The template also includes 16 slides, each available in both light and dark backgrounds, providing you with a range of options to choose from. Whether you’re creating a presentation for a business meeting, a conference, or a school project, this template is a versatile and eye-catching choice that is sure to impress your audience.
Funny Venn Diagram PowerPoint Template
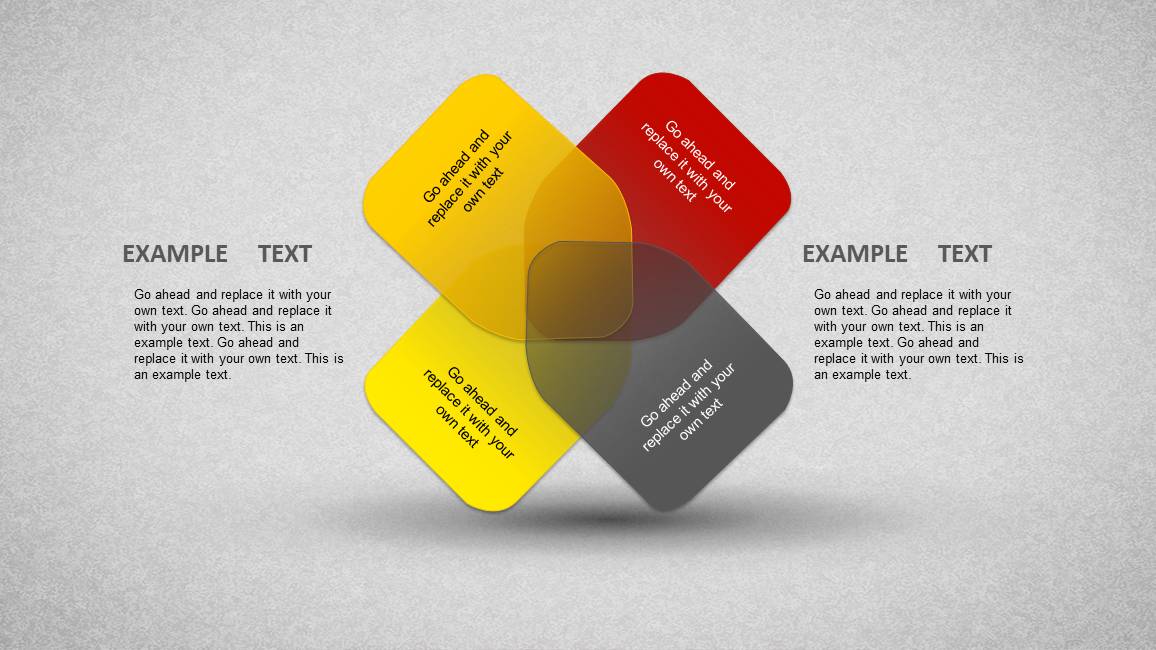
Introducing the Funny Venn Diagram presentation template! This fun and playful template is perfect for adding a touch of humor to your presentations. With its unique tag-shaped figures replacing the standard circles, you’ll be sure to capture your audience’s attention.
The template includes 16 slides, available in both PowerPoint and Google Slides, with a 4:3 ratio. It features 2, 3, and 4 set Venn diagrams, making it a versatile choice for a variety of topics and themes.
With this template, you can present your ideas in a creative and engaging way. The tag-shaped figures add a unique twist to the traditional Venn diagram format, making it both visually interesting and fun.
Whether you’re presenting on business strategies, marketing campaigns, or simply looking to add some fun to your classroom lectures, the Funny Venn Diagram presentation template is a perfect choice. So, download it now and get ready to make your presentations stand out!