
Graphs into PowerPoint diagrams are extremely effective at showcasing and explaining to a group of people where you stand in relation to an aspect of the world around you. For that reason, we’ll be going through and showing you how to insert a graph into a pre-built slide.
Note that the same process for inserting a graph into a pre-built diagram applies whenever you want to insert a graph into any of your projects.
In some of PowerPoint diagrams, we have create shapes that hold the appearance of graphs. This is awesome when wanting to create a sleek template.
We’ll be showing you how to add a dynamic graph/chart into the diagram, thus allowing you to easily edit the
- percentages,
- colors,
- size and much more
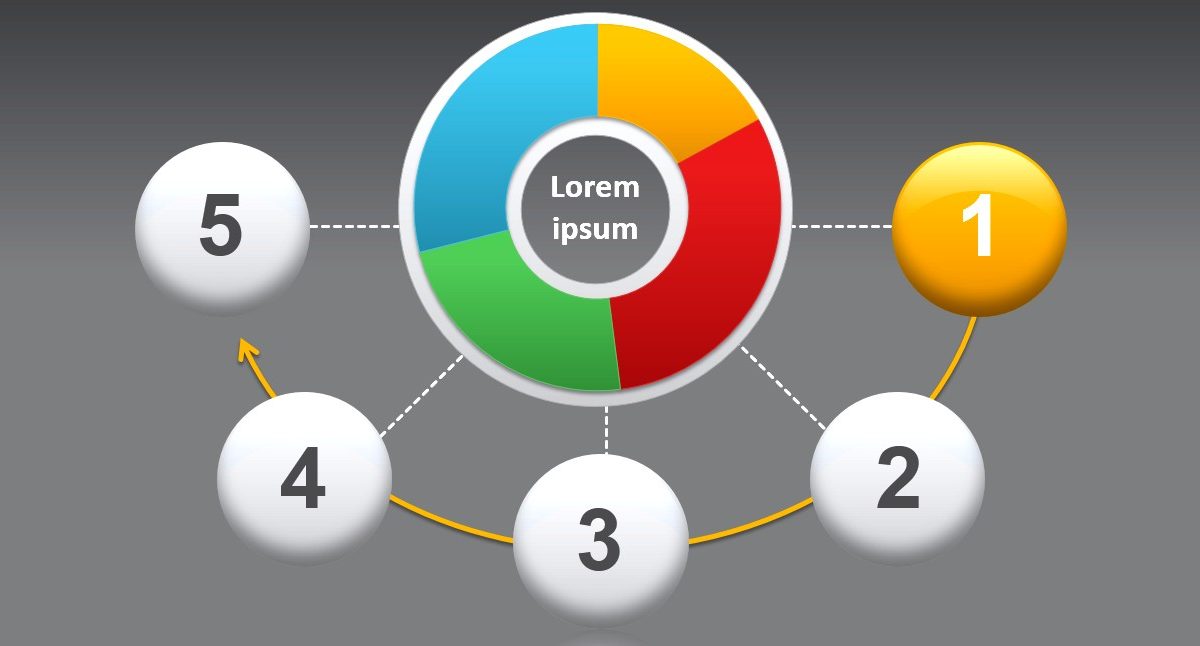
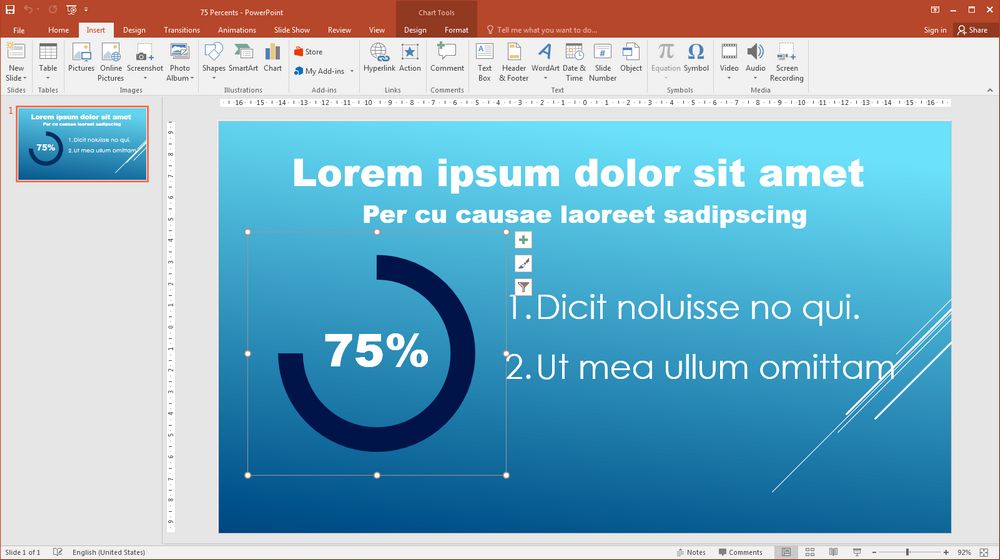
without having to play the role of a graphic designer. Below is a very simple template with shape that we will replace with dynamic graph.

How to insert a graphs into PowerPoint diagrams
The first step is to insert a graph that is the most similar to the shape in the diagram.
Insert a graph in the diagram
Keep in mind that you might not be able to find an exact replacement for the shapes that are already inserted into the diagram.
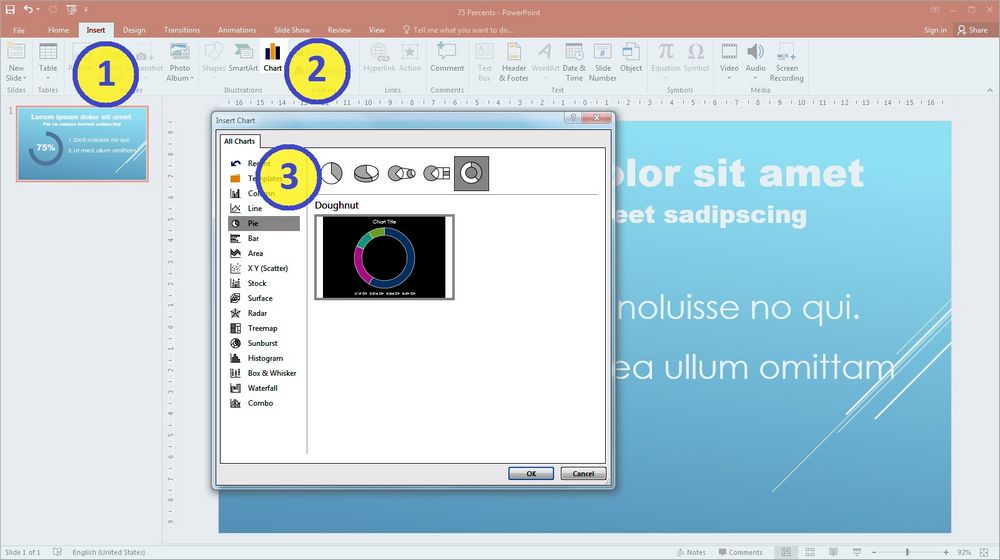
In this example, there is a good replacement graph, and we’ll select that one. To find it, you need
- To go to Insert tab and
- Insert a chart.
- For this case, it is a doughnut pie chart.
Now, you need to modify the pie chart to look as close to the graphic shape as possible.
Modify the pie chart
In this example, there are multiple things that need to happen.
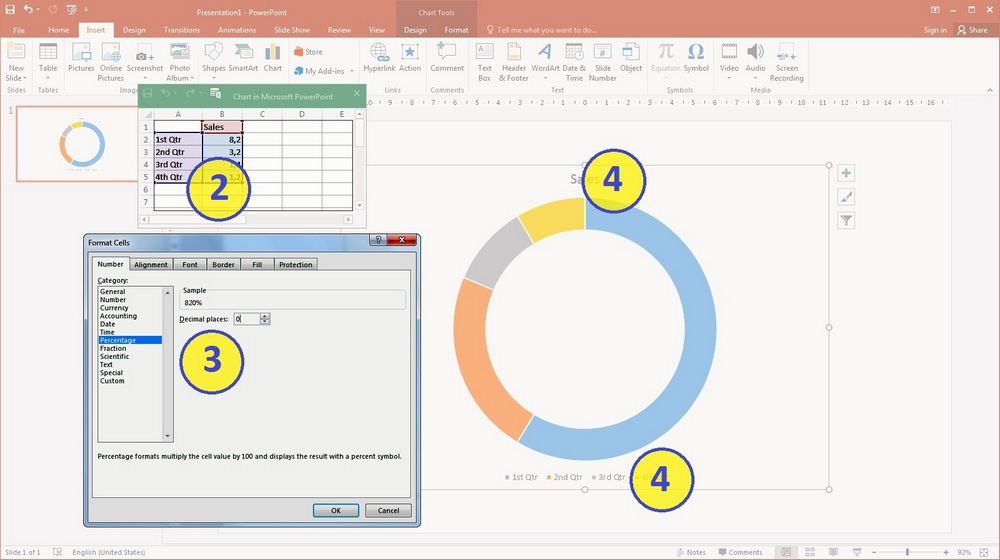
- Right click on the pie graph and choose Edit Data -> Edit Data in Excel.
This will bring up a green Excel window with numbers in it. - In Excel window delete two of the rows so that there are only two rows with numbers in them.
- Change two numbers (and their format if you need) in the 1st Qtr and the 2nd Qtr to be equal to the percentage that is located on the diagram.
- Delete the title and legend by simply clicking on them and then hitting the delete key.
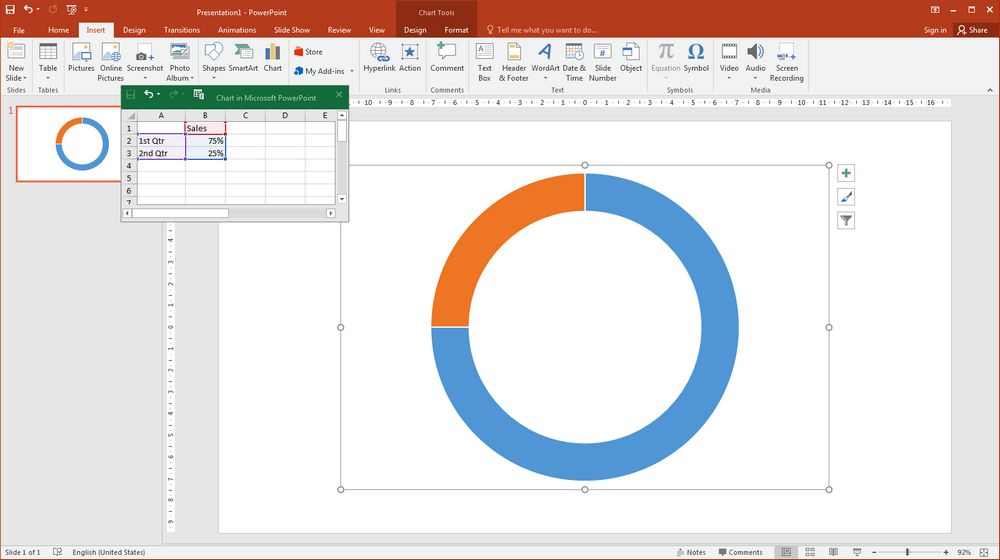
Now you can see that the pie graph is starting to look a lot like the graphic shapes in the pre-built diagram.
Next, you need to pull the colors from the diagram and match them to the pie chart that we are going to insert into the project.
Match the colors of graph with your project
To do this, you need to
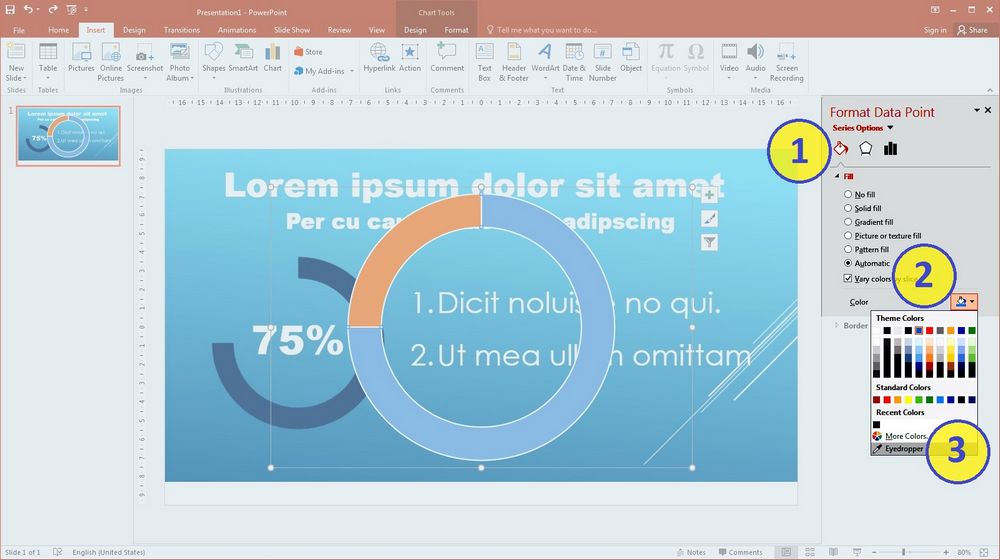
- Double click on either the orange or the blue part of the graph (the colors may be different for you) and then go to the Format Data Point Panel and click on the Paint Bucket.
- Make sure there is a checked box next to the option “Vary colors by slice”. This will allow you to change the color of each slice (which in our case is only two).
- You will need to eyedrop the blue with the same blue as that found on the diagram.
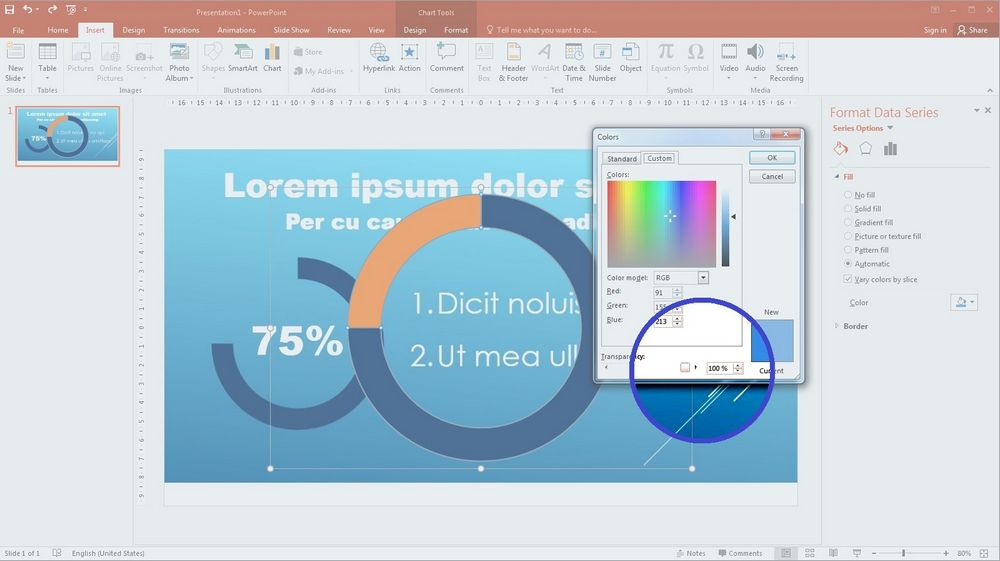
- Then click on the orange slice and make it 100% transparent:
- click Colors on Format Data Series panel
- then click More Colors…
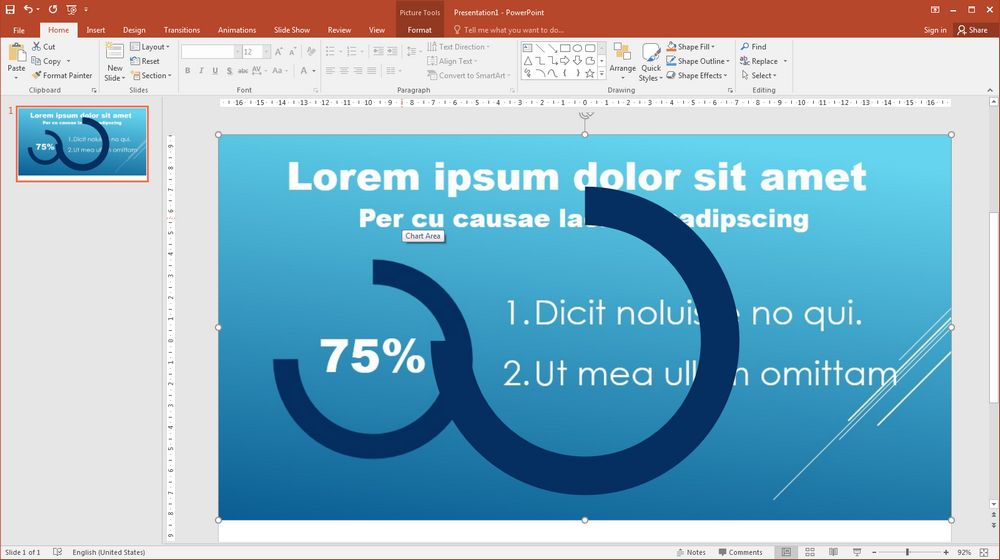
- The last step is to click on the two slices and the Border on Format Data Series panel and remove the borders. Otherwise you will see a white outline surrounding the slices and the background.
Now you should see a graph that looks almost exactly like the shape that came pre-built with the diagram.
And finaly…
Insert graph into your PowerPoint diagram
The last step is to delete the shape in the diagram and insert the graph that we just created and modified.
Now whenever you want to change the percentage on the diagram, you can easily go into the graph and change a few numbers and the graph will change itself.
Beforehand, you would have needed to edit the shape to be approximately the same size and dimensions as the percentage you needed. And believe us, you don’t want to do that.
The original article is here.